Tag Archives: teaching

Presidential election forecasting: a case study

I am sharing several of the case studies I developed for my courses. This example is a spreadsheet model that forecasts outcomes of an election using data from the 2012 Presidential election.

Presidential Election Forecasting

There are a number of mathematical models for predicting who will win the Presidential Election. Many popular forecasting models use simulation to forecast the state-level outcomes based on state polls. The most sophisticated models (like 538) incorporate phenomena such as poll biases, economic data, and momentum. However, even the most sophisticated models are often modeled using spreadsheets.

For this case study, we will look at state-level poll data from the 2012 Presidential election when Barack Obama ran against Mitt Romney. The spreadsheet contains realistic polling numbers from before the election. Simulation is a useful tool for translating the uncertainty in the polls to potential election outcomes.  There are 538 electoral votes: whoever gets 270 or more votes wins.

Assumptions:

  1. Everyone votes for one of two candidates (i.e., no third party candidates – every vote that is not for Obama is for Romney).
  2. The proportion of votes that go to a candidate is normally distributed according to a known mean and standard deviation in every state. We will track Obama’s proportion of the votes since he was the incumbent in 2012.
  3. Whoever gets more than 50% of the votes in a state wins all of the state’s electoral votes. [Note: most but not all states do this].
  4. The votes cast in each state are independent, i.e., the outcome in one state does not affect the outcomes in another.

It is well known that the polls are biased, and that these biases are correlated. This means that there is dependence between state outcomes (lifting assumption #4 above). Let’s assume four of the key swing states have polling bias (Florida, Pennsylvania, Virginia, Wisconsin). A bias here means that the poll average for Obama is too high. Let’s consider biases of 0%, 0.5%, 1%, 1.5%, and 2%. For example, the mean fraction of votes for Obama in Wisconsin is 52%. This mean would change to 50% – 52% depending on the amount of bias.

Using the spreadsheet, simulate the proportion of votes in each state that are for Obama for these 5 scenarios. Run 200 iterations for each simulation. For each iteration, determine the number of electoral votes in each state that go to Obama and Romney and who won.

Outputs:

  1. The total number of electoral votes for Obama
  2. An indicator variable to capture whether Obama won the election.

Tasks:

(1) Create a figure showing the distribution of the total number of electoral votes that go to Obama. Report the probability that he gets 270 or more electoral votes.

(2) Paste the model outputs (the electoral vote average, min, max) and the probability that Obama wins for each of the five bias scenarios.

(3) What is the probability of a tie (exactly 269 votes)? 

Modeling questions to think about:

  1. Obama took 332 electoral votes compared to Romney’s 206. Do you think that this outcome was well-characterized in the model or was it an expected outcome?
  2. Look at the frequency plot of the number of electoral votes for Obama (choose any of the simulations). Why do some electoral vote totals like 307, 313, and 332 occur more frequently than the others?
  3. Why do you think a small bias in 4 states would disproportionately affect the election outcomes?
  4. How do you think the simplifying assumptions affected the model outputs?
  5. No model is perfect, but an imperfect model can still be useful. Do you think this simulation model was useful?

More reading from Punk Rock Operations Research:

How FiveThirtyEight’s forecasting model works: https://fivethirtyeight.com/features/how-fivethirtyeights-2020-presidential-forecast-works-and-whats-different-because-of-covid-19/

Files

  1. The assignment
  2. A shell spreadsheet with basic data to share with students
  3. A spreadsheet with the solutions

More teaching case studies


SIR models: A teaching case study to use in a course about probability models

This past summer, I created a few examples about COVID-19 to use in my course on probability models. I’ll post those materials here as I teach with them. Here is the first case study that introduces SIR models for modeling the spread of infectious disease. SIR models are widely used in epidemiology.

Infectious disease modeling: framing and modeling

Assume we have a constant population with N individuals. We can partition the population into three groups:

  1. Those who are susceptible to disease (S[n], i.e., not infected).
  2. Those who are infected (I[n])
  3. Those who are recovered (R[n]).

We assume a discrete time model, where we are interested in how the number of susceptible, infected, and recovered individuals vary according to time. Therefore, we start at time n=0 and index these values by n. The time between time n and n+1 could represent, say, a week.

A new strain of influenza or a novel coronavirus emerges. Susceptible individuals can become infected after exposure, and infected individuals can recover. Recovered individuals have immunity from reinfection.

New infecteds, result from contact between the susceptibles, and infecteds, with contact rate beta/N, which represents the proportion of contacts an infected individual has. Infecteds are cured at a rate (gamma) proportional to the number of infecteds, which become recovered.

Question #1: Come up with an expression to relate N to S[n], I[n], and R[n].

Question #2: Develop recursive expressions for S[n+1] based on S[n] and perhaps other variables.

Question #3: Then, do the same for I[n+1] and R[n+1].

Question #4: What are the boundary conditions?

Question #5: How would you estimate the total number who become infected by time n? 

Discussion questions:

  1. What other diseases fit this model?
  2. What are some possible ways to reduce the infection rate?
  3. What are some possible ways to increase the recovery rate?
  4. How does a vaccine effect this model?
  5. There is an interruption in the production of the vaccine, and your state will only receive 20% of the vaccines that you need before influenza season begins. Vaccines will slowly be released after this level. What are some criteria we could use to decide how to distribute these vaccines? What else can you do?

The second part performs computation in a spreadsheet. The assignment is here. We use the CDC 2004-5 data from a population of 157,759 samples taken from individuals with flu-like symptoms and 3 initial infections. Let n=0 represent the last week in September, the beginning of influenza season. Then, we compute these numbers in a spreadsheet to see how the disease may evolve. Next, we fit the model parameters (beta and gamma) using data that was collected by minimizing the sum squared error (SSE). Finally, we assess the impact of a vaccine. 

Files:

  1. The assignment.
  2. The solution.
  3. The assignment for the computational part.
  4. A google spreadsheet with the calculations (create a copy or download)

More examples


Pooled testing: a teaching case study to use in a course about probability models

This summer, I created a few examples about COVID-19 to use in my course on probability models. I’ll post those materials here as I teach with them. Here is the first example.

Pooled testing to expand testing capacity

In July 2020, many states struggled to process COVID-19 tests quickly, with some states taking more than a week to process tests. Many statisticians have proposed pooled testing to process tests quicker and effectively expand testing capacity to up to four times the regular capacity. Pooled testing works when few tests come back positive.

Pooled testing came about in the 1940s, when government statisticians needed a more efficient way to screen World War II draftees for syphilis. “The Detection of Defective Members of Large Populations,” by R. Dorfman in 1943 contains a methodology for pooled testing.

Pooled testing works as follows:

  • Tests are grouped that pool n samples together, where each sample reflects an individual’s test sample.
  • Pooled test results are either positive or negative. They come back positive if at least 1 of the n individual samples are positive.
  • For tests that come back positive, tests are rerun individually with the unused portions of the original samples to see which individuals test positive, achieving the same results but faster. A total of n+1 tests are performed.
  • For tests that come back negative, no further testing is needed. We conclude all individuals are negative. One total test is performed, which reduces the overall tests.
  • When pooling is not used, one test per individual yields n tests for the group.

Consider a group of 40 asymptomatic individuals that are tested for COVID-19 in pooled groups of size . Let  denote the number of groups tested, and let  capture the number of groups that test positive (a random variable). We assume that an individual tests positive for COVID-19 with probability  (New York data from July 2020).

  • Express g as a function of n.
  • Express X and its distribution based on g, n, and q.
  • Let the random variable T denote the total number of tests run. Derive an expressive for T as a function of  as well as fixed parameters n and g.
  • Consider test groups of size n = 4, 5, 8, 10, 20. Which group size yields the fewest number of tests performed, on average? (Hint: Find E[T]).
  • How does your answer to the last question change if q = 0.02, 0.02, 0.075? (Note: Dane County had q = 0.02 and Wisconsin had q = 0.075 at the end of July 2020. At the time I wrote this in early October 2020, more than 20% of COVID tests are coming back positive in Wisconsin).

You can read more on the New York Times article that inspired this case study.

Files:

  1. The assignment.
  2. The solution.
  3. A google spreadsheet with the calculations (create a copy or download)

My teaching journey: there and back again

Today I gave the keynote talk for the spring New Educator’s Workshop for teaching assistants at UW-Madison. I’m posting my slides here. My talk was entitled, “My teaching journey: there and back again.”

Abstract. I will talk about my journey from a painfully shy TA to a professor who is comfortable in the classroom and when talking to the media about research on the evening news. I will talk about strategies I used to be effective in the classroom given my strengths (and weaknesses).  Topics include time management, active learning techniques, easy ways to teach with technology, tips for managing student expectations, and things I wish I knew when I was starting to teach.


Blog posts that inspired my presentation:


What I do for diversity and inclusion in the classroom

A series of incidents of hate and bias on the University of Wisconsin-Madison campus has prompted campus officials and my dean in the College of Engineering to send out a letter to faculty stating that the College of Engineering will embark on a multi-year process to provide implicit bias training for students, faculty, and staff. I applaud these efforts. I also recognize that most of the incidents are happening outside of the classroom where I cannot see them. Still, it’s imperative that administrators and professors lead on the issue of diversity and inclusion. Showing our students that we are committed to diversity and inclusion will play an important role in helping students feel welcome and safe on campus.

This is what I try to do for all students, with the intent that it may make more of a difference to marginalized students such as underrepresented minority (URMs), women students, students from disadvantaged backgrounds, or students with disabilities. I recognize that I am not perfect. I am always trying to learn and improve. Feedback is very welcome.

Note about myself: I am a women in engineering who has a lot of experience in diversity and inclusion efforts for women in engineering. When I was a student, I felt like a fraud, I felt marginalized at times, and I felt like I did not always have a voice. But I am not a diversity expert; I’m just a diversity fangirl. I try to do small things with great love and to continually improve what I do. My goal as a professor is to help all my students feel “welcome at the table” so to speak.

What I do in the classroom:

  1. I strive to treat all students the same. This means treating each student like an individual and responding to their individual needs. This will be a lifelong challenge because I am human and surely hold on to some stereotypes. I make it a goal to give all students the same opportunities as opposed to trying to “correct” for biases I may have (which can make things worse — see stereotype threat).
  2. I give a sense that my course is challenging but doable, with an emphasis on doable. I never only tell students how hard engineering is, because students who are marginalized in any way sometimes get the message that if they find something hard, it means they are inherently bad at it and will not be successful. Instead, I focus on the “doable” part. Recognizing that student abilities are malleable is a positive message that directly combats notions that a student is not welcome or is flawed.
  3. I do not use gender or names in any generic classroom examples (no “he” or “she” in classroom examples when referring to an engineer who is solving a problem about simulation).
  4. I am careful when “randomly” assigning student groups. I try to ensure that there isn’t only one woman student in a group, for example. I usually let students choose their own group so they are most comfortable.
  5. I strive to give all students a voice. I ask students what they think when talking with students doing group work in class. That way, I can “give” everyone a voice, which is particularly important for students from marginalized groups who do not feel like they have a voice.
  6. I touch base with students during active learning segments in class, even if they do not ask for help. Students who do not feel “welcome to the table” often do not ask for help because they feel like a fraud. Helping students clear small hurdles in class can build their confidence. Again, I like to focus on how engineering is “doable” and how skills can be learned.
  7. I talk about imposter syndrome in the classroom (this is not for everyone).
  8. I talk about stereotype threat in the classroom (this is really not for everyone).
  9. I give a class of students a positive affirmation before an exam. I remind my students about how much they have learned and how I believe they have come a long way. If they ask if the test is hard (and they always do), I say it’s tough but fair and doable. I keep the messages positive to counteract stereotype threat. In fact, this is one of the most effective ways for teachers to improve the test scores of marginalized students:
    • “One of the most powerful things teachers can do to offset the stereotype threat and bolster student performance is to prompt students to reflect on their talents, beliefs and values. These kinds of “affirmations” remind students of what’s important to them and can build a line of defense against stereotype threat.” [Reference]

What I do outside of the classroom aimed at improving student access to opportunities and achievement. Usually these things take place during office hours and advising:

  1. I ask students about their plans for the summer and encourage them to consider internships, co-ops, research experiences for undergraduates (REUs).
  2. I invite students to department events (colloquiums, receptions, reunions, etc.)
  3. I talk to students about graduate school. This is a big one. Graduate school is not on everyone’s radar, and telling a student they should think about graduate school because they have something to offer is sometimes a life-changing conversation for a marginalized student.
  4. I serve as a reference for students (if they ask me) and be even-handed in how I refer to students in the letters (see this word cloud of words used in letters for men and in letters for women).
  5. I tell a student that I believe in their abilities and know they will be successful as a future industrial engineer when they stop in for office hours, when the going gets tough, at the department graduation party, etc. Positive affirmations.
  6. I congratulate an underrepresented minority (URM) or women student for an achievement (internship, new job, award, etc.) and ensure that awards get publicized in the department and college.
  7. I nominate the student for a campus or department award and write a letter of recommendation for the student if one is needed.
  8. I publicize department opportunities in the classroom (for department scholarships, etc.) and personally recommend that students apply for a department scholarship award.
  9. I try to rid myself of stereotypes and biases I have by reading about biases when I can.

What I do with my colleagues:

  1. Add items to related to diversity and inclusion to the meeting agendas.
  2. Bring up issues of diversity and inclusion when discusses new classes, especially those for freshmen where inclusion should be a goal.
  3. Encourage inviting speakers from underrepresented groups to give department colloquiums.
  4. Ask colloquium speakers, especially those from underrepresented groups, to speak to graduate students when they visit.
  5. Encourage colleagues to ask candidates from underrepresented groups to apply for faculty positions (and do so myself).

I want to reiterate that I am not an expert. These tips are things that work for me, and I know I am leaving some top tips out. This list from Vanderbilt contains some additional recommendations and suggestions for learning more. What do you do in and out of the classroom? Help me improve.

Articles on bias:

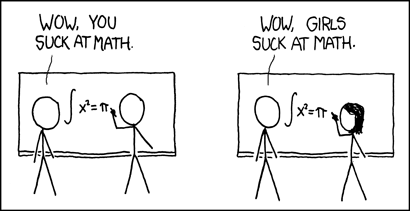
XKCD comic called “How it works” because this is absolutely not how it should work.

Edits on 4/27 to include my tweets about this post:


Update on 7/15/16. I discovered this paper from PLoS called “Peer-Led Team Learning Helps Minority Students Succeed

Peer-Led Team Learning and active learning has been shown to reduce grade disparities between underrepresented minority students and students from more white and privileged backgrounds. Lecturing has the highest level of disparity. Other research out there done by education experts suggest that if you care about diversity, you should replace lecturing with active learning. I have some work to do, but it’s great to know how to target my teaching efforts.

Update on 3/29/18

Francis Edward Su wrote an article entitled “Mathematical Microaggressions” about creating a growth mindset in class to help a diverse set of students reach their potential.

Markus Brauer at UW-Madison has a handout with some suggestions for teaching in a diverse classroom. Here are some of his suggestions based on published evidence in the literature.

  1. Insist on the “utility value” of the material you are teaching in class. Explain clearly how the students will be able to use the knowledge they learn in your class later in life. Some studies suggest that this is beneficial for all students, but particularly for students from historically underrepresented populations.
  2. Ask all students to express what they value and why these values are important for them.
  3. Specify in your syllabus what tasks students will have to fulfill in your class and post your website ahead of time. This way, students can see if certain disabilities prevent them from having a positive learning experience in the class.
  4. Communicate that most students feel in the first semesters that they do not “belong” but that most of them tend to overcome these difficulties and end up feeling quite connected in later semesters.
  5. Build some flexibility in your assignment schedule. For example, allows students to have in 1 assignment up to 48 hours late with no penalty. This is essential for students with certain types of disabilities, such as mental illness.
  6. Be aware that you don’t have to call on the first student who raises their hand. Take the time to call on students who rarely talk in class to encourage everyone to give verbal and non-verbal feedback.
  7. When presenting empirical results, show pictures of the scientists who conducted the research. Do so especially when the researcher is a woman or a URM.
  8. Consider doing “low impact testing,” where students can take the quiz multiple times until they get all the answers right. These types of activities should account for <10% of the final grade. This type of activity tends to help pull up students with the lowest grades.
  9. Do not grade according to a curve. Instead, use an a priori grading scheme.
  10. When talking about groups, emphasize the groups’ heterogeneity and discuss the large within-group differences. Making salient that a stigmatized group is heterogeneous creates more positive feelings toward this group.

integer programming for locating ambulances

Last week I visited Oberlin College to deliver the Fuzzy Vance Lecture in Mathematics (see post here). In addition, I gave two lectures to Bob Bosch’s undergraduate optimization course. I will post my materials for both of my lectures on my blog. The first lecture was related to my evening talk and focused on ambulance location models and modeling integer programs.

The purpose of the lecture was to work on modeling in integer programming. We focused on coverage models and worked through two of the three models that successively lift simplifying assumptions (in a 75 minute lecture). The “Integer Programming Bag of Tricks” on slide 18 contains a series of constraints for modeling conditional constraints (courtesy of Jeff Linderoth and Jim Luedtke). We use these tricks to assign at least L calls for service (demand) to stations–but only stations that are “open”–in the modeling exercise. Slides are below.

Related reading:


just write, damn it

I’ve had little time to write lately, so writing feels like a guilty pleasure when I have the time to do it. I am advising four PhD students who often ask me about the writing process. I’ve almost forgotten about how hard technical writing was for me back when I was in their shoes.

Roger Ebert’s memoir Life Itself  jarred my memory. This weekend, I was listening to the audiobook while working on on my yard. One passage about writing got my attention:

[Bill] Lyon watched as I ripped one sheet of copy paper after another out of my typewriter and finally gave me the most useful advice I have ever received as a writer: “One, don’t wait for inspiration, just start the damned thing. Two, once you begin, keep on until the end. How do you know how the story should begin until you find out where it’s going?” These rules saved me half a career’s worth of time and gained me a reputation as the fastest writer in town. I’m not faster. I spend less time not writing.

Part one is really great advice. I’m a firm believer in writing as you go. I’m not so sure about part two for students writing their first article or thesis. First, most of the time it is even feasible to write until you reach the end. Second, organization helps when writing a lengthy manuscript (lengthy here is relative to newspaper articles). It’s usually easier to write when you have an outline that lays out your ideas in a straightforward fashion. You should know where you’re going. But if organization paralyzes you, I recommend just starting the damned thing and reorganizing later. Students seem to struggle with writing sins of omission – the biggest mistake is not getting started. If you want to finish something, you need to start it first.

When searching for Roger Ebert’s comment on writing, I found similar advice from Matt Zoller Seitz about writing movie reviews on rogerebert.com:

Just write, damn it. I believe that ninety percent of writer’s block is not the fault of the writer. It’s the fault of the writer’s wrongheaded educational conditioning. We’re taught to write via a 20th century industrial model that’s boringly linear and predictable: What’s your topic sentence? What are your sections? What’s your conclusion? Nobody wants to read a piece that’s structured that way. Even if they did, the form would be more a hindrance than a help to the writing process, because it makes the writer settle on a thesis before he or she has had a chance to wade around in the ideas and inspect them. So to Hell with the outline. Just puke on the page, knowing that you can clean it up and make it structurally sound later. Your mind is a babbling lunatic. It’s Dennis Hopper, jumping all over the place, free associating, digressing, doubling back, exploding in profanity and absurdity and nonsense. Stop ordering it to calm down and speak clearly. Listen closely and take dictation. Be a stenographer for your subconscious. Then rewrite and edit.

This isn’t quite the right advice for writing a thesis, but students should hear this. Students know they are supposed to organize. They seem less familiar with the idea of puking on the page, knowing that they can clean it up and make it structurally sound later. The latter approach is how I start almost all of my blog posts (most get cleaned up later).

How do you write?


some students don’t learn a whole lot in college

A few years ago, researchers Richard Arum and Josipa Roksa released a book called “Academically Adrift” that claims that many students don’t leave college with new knowledge and new skills [Link to an article in the Chronicle]: Here is what they found:

Growing numbers of students are sent to college at increasingly higher costs, but for a large proportion of them the gains in critical thinking, complex reasoning, and written communication are either exceedingly small or empirically nonexistent. At least 45 percent of students in our sample did not demonstrate any statistically significant improvement in Collegiate Learning Assessment [CLA] performance during the first two years of college. [Further study has indicated that 36 percent of students did not show any significant improvement over four years.]

The CLA is a proxy measure for what students learned during college. This suggests that more than a third of college students do not demonstrate any improvement in critical thinking during college. This is a tragedy. College is expensive.

Now there are a few things to note. Most obviously, these results are averaged across all students in all majors at all universities. Your mileage may vary. I share this information with my students on the first day of class. I challenge my students, but I think they will get their money’s worth from my class and will leave with tangible improvements in critical thinking and complex reasoning (and sometimes written communication, but I could do more with writing).

Students who did the best didn’t always go to the best universities (but that helps). Students with high levels of learning:

  • studied alone (yeah for introverts!)
  • had professors with high academic expectations
  • studied traditional liberal arts and sciences (as compared to business, education and communications).

This suggests the only thing I can do as a professor is to have high expectations for students (and to give assignments that raise these expectations).

I realize that in the big picture, some programs are quite competitive and attract the types of students who like being challenged and as a result, are challenged. But I realize it’s more complicated than this: there is a push and pull between professors and students about expectations (see this article about a teaching assistant at Columbia who inflated grades because so many students complained and it’s been widely reported that college students study much less than they used to). In general, these researchers found that professors do not expect much of the students and assign almost no homework.

A follow up report is out [Link] called “Aspiring Adults Adrift.” The authors found that the same students who didn’t learn much in college continue to struggle with employment afterward. What they find is really interesting. The same students that didn’t do well on the CLA were more likely to be unemployed, under employed, employed in a job with low skill requirements, and laid off. In other words, employers are good at recognizing who developed more skills in college and who didn’t.

The research suggests that some students don’t want to be challenged or to learn; they just want a degree. It’s not fun to “teach” students who don’t want to learn anything.

Interestingly, the students themselves cannot tell if they’ve learned a lot in college. They all assume they’ve learned a lot! This is not good. It implies that students are not good consumers when it comes to investing in their educations, and don’t see implications of taking blow off courses or choosing easy programs. (Side note: this is a reason why students should not estimate how much they’ve learned in end of the semester teaching evaluations.) The article ends with an important point:

Yet those same students continue to believe they got a great education, even after two years of struggle [after graduation]. This suggests a fundamental failure in the higher education market — while employers can tell the difference between those who learned in college and those who were left academically adrift, the students themselves cannot.

Finally, correction at the end of the NY Times article made me cringe:

“An earlier version of this article incorrectly used a male courtesy title for Josipa Roksa. She is a woman.”

I am curious about how you challenge students in tough classes. I’ve been given a lot of teaching advice of the years, and most of it hasn’t been very useful or practical (“Just be an extroverted man with CEO hair and you’ll do great!”). Teaching is definitely all about managing expectations, and I’d like to do that without caving and giving everyone an A (I don’t!). I’m sure I have a lot to learn from my readers who I know teach a lot of “hard” courses.

https://twitter.com/lauramclay/status/390156734490087424


do you have any material for teaching undergraduate simulation?

I am teaching an undergraduate simulation course in the spring to industrial engineering students. I have plenty of lecture notes from colleagues, but I am missing simple classroom demos (like an Excel spreadsheet), classroom modeling activities, and case studies. This is a bleg for additional material to enhance my teaching. Please email me with any material or post a link. Thank you in advance!


math is your superpower

Today was my last class of the semester before the final. In most of my courses, I give a fun talk about what professors really do outside of the classroom. I also go over my one (or seven) things that I want students to learn from me every semester. At the end of the talk, I tell students that while our world is becoming more complex and quantitative, math is often underused. Math is a superpower.

I once heard that the world runs on eighth grade math. I don’t think that is true for many industries (especially the ones that hire operations research graduates!), but a study compiled in a Northeastern University study shows that few Americans use advanced mathematics on the job [Link to the Jordan Weissman article in The Atlantic].

I remain optimistic about the need for advanced math. First, it’s possible that few workers use math because few workers are proficient in math. In fact, “Upper Blue Collar” workers are the most likely to use math. This should motivate us to teach math better, not to conclude that it isn’t needed. Second, it’s worth noting that the Northeastern study data is summarized across the workers surveyed (not across industries or companies). It’s certainly possible that nearly all companies perform statistics but that relatively few workers actually do the statistics (22% of upper white collar workers in the figure above) and that the average worker isn’t always aware of it.

The bottom line is that the survey suggests that relatively few workers do the hard number crunching, so there is a competitive advantage for those who are willing and able to do it. Math may not really be a super power, but it’s something that most workers do not get to enjoy on a regular basis.