Tag Archives: public policy

It’s National Emergency Medical Services Week #EMSweek2019. Check out my papers and presentations about EMS systems.

This week is National Emergency Medical Services Week. I’ve published and spoken extensively about my research on emergency medical services.

Some blog posts about EMS include:

Mike Trick wrote a post about my semi-plenary talk at the 2014 German OR Society conference entitled “Using analytics for emergency response


Papers include:

  1. McLay, L.A., A Maximum Expected Covering Location Model with Two Types of ServersIIE Transactions 41(8), 730 – 741.
  2. McLay, L.A. and M.E. Mayorga, 2010. Evaluating Emergency Medical Service Performance MeasuresHealth Care Management Science 13(2), 124 – 136.
  3. McLay, L.A., Mayorga, M.E., 2011. Evaluating the Impact of Performance Goals on Dispatching Decisions in Emergency Medical ServiceIIE Transactions on Healthcare Service Engineering 1, 185 – 196.
  4. Chanta, S., Mayorga, M.E., Kurz, M.E., McLay, L.A., 2011. The minimum p-envy location problem: A new model for equitable distribution of emergency resourcesIIE Transactions on Healthcare Systems Engineering 1(2), 101 – 115.
  5. McLay, L.A., Moore, H. 2012. Hanover County Improves Its Response to Emergency Medical 911 CallsInterfaces 42(4), 380-394.
  6. Bandar, D., Mayorga, M.E., McLay, L.A., 2012. Optimal Dispatching Strategies for Emergency Vehicles to Increase Patient SurvivabilityInternational Journal of Operational Research.
  7. McLay, L.A., Brooks, J.P., Boone, E.L., 2012. Analyzing the Volume and Nature of Emergency Medical Calls during Severe Weather Events using Regression MethodologiesSocio-Economic Planning Sciences 46, 55 – 66.
  8. Kunkel, A., McLay, L.A. 2013. Determining minimum staffing levels during snowstorms using an integrated simulation, regression, and reliability modelHealth Care Management Science 16(1), 14 – 26.
  9. McLay, L.A., Mayorga, M.E., 2013. A model for optimally dispatching ambulances to emergency calls with classification errors in patient prioritiesIIE Transactions 45(1), 1—24. This paper was selected as a Best Paper Award for IIE Transactions Focused Issue on Scheduling and Logistics.
  10. Mayorga, M.E., Bandara, D., McLay, L.A., 2013. Districting and dispatching policies for emergency medical service systems to improve patient survivalIIE Transactions on Healthcare Systems Engineering 3(1), 39 – 56.
  11. Toro-Diaz, H., Mayorga, M.E., Chanta, S., McLay, L.A., 2013. Joint location and dispatching decisions for Emergency Medical ServicesComputers & Industrial Engineering 64(4), 917 – 928.
  12. Dreiding, R.A., McLay, L.A., An Integrated Screening Model for Screening Cargo Containers for Nuclear WeaponsEuropean Journal of Operational Research 230, 181 – 189.
  13. Chanta, S., Mayorga, M. E., McLay, L. A., 2014. Improving Rural Emergency Services without Sacrificing Coverage: A Bi-Objective Covering Location Model for EMS SystemsAnnals of Operations Research 221(1), 133 – 159.
  14. Sudtachat, K., Mayorga, M.E., McLay, L.A. 2014. Recommendations for Dispatching Emergency Vehicles under Multi-tiered Response via SimulationInternational Transactions in Operational Research 21(4), 581-617.
  15. Chanta, S., Mayorga, M.E., McLay, L.A., 2014. The minimum p-envy problem with requirement on minimum survival rateComputers & Industrial Engineering 74, 228 – 239.
  16. Bandara, D., Mayorga, M.E., McLay, L.A., 2014. Priority Dispatching Strategies for EMS SystemsThe Journal of the Operational Research Society 65, 572 – 587.
  17. Grannan, B.C., Bastian, N., McLay, L.A. A Maximum Expected Covering Problem for Locating and Dispatching Two Classes of Military Medical Evacuation Air AssetsOperations Research Letters 9, 1511-1531.
  18. Toro-Diaz, H., Mayorga, M.E., McLay, L.A., Rajagopalan, H., Saydem, C., Reducing disparities in large scale emergency medical service systemsJournal of the Operational Research Society 66, 1169-1181. doi:10.1057/jors.2014.83
  19. McLay, L.A., Mayorga, M.E., 2013. A dispatching model for server-to-customer systems that balances efficiency and equityManufacturing & Service Operations Management 15(2), 205 – 200.
  20. Ansari, S., McLay, L.A., Mayorga, M.E., 2015. A Maximum Expected Covering Problem for District DesignTransportation Science 51(1), 376 – 390.
  21. Sudtachat, K., Mayorga, M.E., McLay, L.A., 2016. A Nested-Compliance Table Policy for Emergency Medical Service Systems under RelocationOMEGA 58, 154 – 168.
  22. Ansari, S., Yoon, S., Albert, L. A., 2017. An approximate Hypercube model for public service systems with co-located servers and multiple responseTransportation Research Part E: Logistics and Transportation Review. 103, 143 – 157. DOI: 1016/j.tre.2017.04.013.
  23. Yoon, S., Albert, L. An Expected Coverage Model with a Cutoff Priority QueueHealth Care Management Science 21(4), 517 – 533. DOI: https://doi.org/10.1007/s10729-017-9409-3.
  24. Enayati, S., Mayorga, M., Toro-Diaz, H., Albert, L. 2018. Identifying trade-offs in equity and efficiency for simultaneously optimizing location and multi-priority dispatch of ambulancesInternational Transactions in Operational Research 26, 415 – 438. DOI:1111/itor.12590
  25. Yoon, S. and Albert, L.A., 2018. Dynamic Resource Assignment for Emergency Response with Multiple Types of Vehicles, Submitted to Operations Research, October 2018.
  26. Yoon, S., and Albert, L.A. A dynamic ambulance routing model with multiple response. Submitted to Transportation Research Part E: Logistics and Transportation Review, January 2019.
2018 INFORMS Government & Analytics Summit: a recap

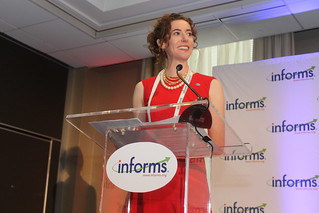
I chaired the 2018 INFORMS Government & Analytics Summit, an outreach event to government policymakers and Congressional staffers about how operations research can save lives, save money, and solve problems. It was a blast. Here is a recap of the event. Please visit the website for more information and to find recordings of the talks that will be posted soon. INFORMS Executive Director Melissa Moore kicked off the Summit with the following video:

I gave a few opening remarks and gave a quick, non-technical overview of operations research and analytics:

Secretary Anthony Foxx and General Michael Hayden gave the two keynotes that were the center of the Summit. Both speakers were experienced, understood the value proposition that OR and analytics offer to government officials and policymakers, and are dynamic and engaging speakers.

Former Transportation Secretary Foxx focused on transportation, and he emphasized the importance of integrating transportation solutions. In the United States, transportation is decentralized, with decisions, operations, and maintenance being made by many players, including the Federal government, local governments, and the private sector. A challenge is in developing a cohesive transportation plan with so many players. It is further compounded by transportation data that is collected and owned by so many of these players and stored at various sites. Yet Foxx was optimistic about our ability to bring these transportation issues together and solve problems. Foxx noted, “Waze knows more about transportation activity than I ever knew as Transportation Secretary.”

Foxx noted that transportation is not just a transportation problem. Transportation plays a key role in building communities, should be people-centric, and impacts community health. Transportation solutions should strive to build better communities, not just expand transportation infrastructure. He discussed the smart city initiative as an avenue to incentive cities to develop plans that integrate transportation plans with other objectives.

General Michael Hayden’s talk focused on guiding policy decisions in a post truth world. Intelligence is centered on making fact-based decisions and in collecting facts and expert judgement that are consistent with the facts. We increasingly live in a post-truth world, where decisions are made on feeling, emotion, loyalty, tribe and identify. These factors increasingly inform our truth, not the facts.

General Hayden’s talk was fascinating and philosophical at times. He mentioned Oxford Dictionary’s word of the year (post-truth) and discussed how the Enlightenment philosophy based on truth, data, hypotheses, and validation inspired our founding fathers. He discussed the flow of information and ideas as a system with reinforcement, cycles, and feedback loops. He views information flow as a structured system. He noted that intelligence is pessimistic and policy is optimistic. I wholeheartedly agree with the latter; I even wrote a blog post about it.

Hayden ended his talk with advice on how to work with decision makers. As NSA director, he worked with many decision-makers who were not in his field and not always enthusiastic about the facts and analysis he brought to the table. He found it helpful to use intelligence as a way to bound the possible policy decisions. By putting a box around the set of feasible policy decisions, he could help rule out bad and disastrous decisions from consideration. This also helped the decision-maker (often, a President) feel like the one in charge with input from an intelligence expert, which was helpful in facilitating productive conversations.

The three panels focused on transportation, national security, and healthcare. The INFORMS member experts and moderators were outstanding!

Healthcare

Jim Bagian, University of Michigan

Sommer Gentry, U.S. Naval Academy

Eva Lee, Georgia Tech

Julie Swann, N.C. State

Moderator: Don Kleinmuntz


Transportation

Saif Benjaafar, University of Minnesota

Pooja Dewan, BNSF

Peter Frazier, Cornell University & Uber

Steve Sashihara, Princeton Consultants

Moderator: José Holguín-Veras, Rensselaer Polytechnic Institute


National Security

David Alderson, Naval Postgraduate School

Natalie Scala, Towson University

Harrison Schramm, CAP, Center for Strategic and Budgetary Analysis

Moderator: Col. Greg Parlier (Ret.)


As chair, I would like to mention that we were fortunate to have many nominations and would have liked to have more opportunities to participate in the Summit. Moving forward there will be other opportunities to support INFORMS’ advocacy activities. We look forward to the chance to involve even more members as we work to help make sure policymakers in Washington better understand and appreciate how they can leverage O.R. and Analytics to help save lives, save money and solve problems.

I want to thank the INFORMS Staff and especially Jeff Cohen for making the INFORMS Government & Analytics Summit a reality.


IMG_4946


reminder: wicked problems are really, really hard to solve

My interest in public sector operations research has led me to appreciate so-called “wicked problems” (as opposed to “tame” problems). Wicked problems often reflect the soft side of operations research and are why some models are so complex. Due to the social component of the problem, there are many stakeholders with contradictory needs. A problem that is wicked quickly unravels due to the connections it has to other issues that are also social, and so on. Russell Ackoff summed this up nicely:

“Every problem interacts with other problems and is therefore part of a set of interrelated problems, a system of problems…. I choose to call such a system a mess.”

Here are a few slides on wicked problems from my Public Sector OR course:

I recommend C. West Churchman’s guest editorial in Management Science in 1967, where the term “wicked problems” was coined [pdf: Wicked Problems Churchman 1967] and this nice article on “wicked” problems by John Mingers in OR/MS Today.

Related reading:


Public sector operations research: the course!

Course introduction

I taught a PhD seminar on public sector operations research this semester. You can read more about the course here. I had students blog in lieu of problem sets and exams They did a terrific job [Find the blog here!]. This post contains summary of what we covered in the course, including the readings and papers presented in class.

Readings

Public Safety Overview

  • Green, L.V. and Kolesar, P.J., 2004. Anniversary article: Improving emergency responsiveness with management science. Management Science, 50(8), pp.1001-1014.
  • Larson, R.C., 2002. Public sector operations research: A personal journey.Operations Research, 50(1), pp.135-145.
  • Rittel, H.W. and Webber, M.M., 1973. Dilemmas in a general theory of planning. Policy sciences, 4(2), pp.155-169.
  • Johnson, M.P., 2012. Community-Based Operations Research: Introduction, Theory, and Applications. In Community-Based Operations Research (pp. 3-36). Springer New York. (Originally an INFORMS TutORial)
  • Goldberg, J.B., 2004. Operations research models for the deployment of emergency services vehicles. EMS Management Journal, 1(1), pp.20-39.
  • Swersey, A.J., 1994. The deployment of police, fire, and emergency medical units. Handbooks in operations research and management science, 6, pp.151-200.
  • McLay, L.A., 2010. Emergency medical service systems that improve patient survivability. Wiley Encyclopedia of Operations Research and Management Science.

Facility location

  • Daskin, M.S., 2008. What you should know about location modeling. Naval Research Logistics, 55(4), pp.283-294.
  • Brotcorne, L., Laporte, G. and Semet, F., 2003. Ambulance location and relocation models. European journal of operational research, 147(3), pp.451-463.

Probability models for public safety

  • Larson, R.C. and Odoni, A.R., 1981. Urban operations research. This was the textbook we used to cover probability models, queueing, priority queueing, and spatial queues (the hypercube model).

Disasters, Homeland Security, and Emergency Management

Deterministic Network Interdiction

  • Smith, J.C., 2010. Basic interdiction models. Wiley Encyclopedia of Operations Research and Management Science.
  • Morton, D.P., 2011. Stochastic network interdiction. Wiley Encyclopedia of Operations Research and Management Science.

Papers presented by students in class

Papers selected for the first set of student presentations (background papers)

  • Blumstein, A., 2002. Crime Modeling. Operations Research, 50(1), pp.16-24.
  • Kaplan, E.H., 2008. Adventures in policy modeling! Operations research in the community and beyond. Omega, 36(1), pp.1-9.
  • Wright, P.D., Liberatore, M.J. and Nydick, R.L., 2006. A survey of operations research models and applications in homeland security. Interfaces, 36(6), pp.514-529.
  • Altay, N. and Green, W.G., 2006. OR/MS research in disaster operations management. European journal of operational research, 175(1), pp.475-493.
  • Simpson, N.C. and Hancock, P.G., 2009. Fifty years of operational research and emergency response. Journal of the Operational Research Society, pp.S126-S139.
  • Larson, R.C., 1987. Social justice and the psychology of queueing. Operations research, 35(6), pp.895-905.

Papers selected for the second set of student presentations (methods)

  • Ashlagi, I. and Shi, P., 2014. Improving community cohesion in school choice via correlated-lottery implementation. Operations Research, 62(6), pp.1247-1264.
  • Mandell, M.B., 1991. Modelling effectiveness-equity trade-offs in public service delivery systems. Management Science, 37(4), pp.467-482.
  • Cormican, K.J., Morton, D.P. and Wood, R.K., 1998. Stochastic network interdiction. Operations Research, 46(2), pp.184-197.
  • Brown, G.G., Carlyle, W.M., Harney, R.C., Skroch, E.M. and Wood, R.K., 2009. Interdicting a nuclear-weapons project. Operations Research, 57(4), pp.866-877.
  • Lim, C. and Smith, J.C., 2007. Algorithms for discrete and continuous multicommodity flow network interdiction problems. IIE Transactions, 39(1), pp.15-26.
  • Rath, S. and Gutjahr, W.J., 2014. A math-heuristic for the warehouse location–routing problem in disaster relief. Computers & Operations Research, 42, pp.25-39.
  • Argon, N.T. and Ziya, S., 2009. Priority assignment under imperfect information on customer type identities. Manufacturing & Service Operations Management, 11(4), pp.674-693.
  • Pita, J., Jain, M., Marecki, J., Ordóñez, F., Portway, C., Tambe, M., Western, C., Paruchuri, P. and Kraus, S., 2008, May. Deployed ARMOR protection: the application of a game theoretic model for security at the Los Angeles International Airport. In Proceedings of the 7th international joint conference on Autonomous agents and multiagent systems: industrial track(pp. 125-132). International Foundation for Autonomous Agents and Multiagent Systems.
  • Mills, A.F., Argon, N.T. and Ziya, S., 2013. Resource-based patient prioritization in mass-casualty incidents. Manufacturing & Service Operations Management, 15(3), pp.361-377.
  • Mehrotra, A., Johnson, E.L. and Nemhauser, G.L., 1998. An optimization based heuristic for political districting. Management Science, 44(8), pp.1100-1114.
  • Koç, A. and Morton, D.P., 2014. Prioritization via stochastic optimization.Management Science, 61(3), pp.586-603.

I missed a class to attend the INFORMS Analytics meeting. I assigned two videos about public sector OR in lieu of class:

Jon Caulkins’ Omega Rho talk on crime modeling and policy

Eoin O’Malley’s talk about bike sharing and optimization (start at 3:51:53)

Blog posts I used in teaching:

We played Pandemic on the last day of class!

twitter-psor.PNG


my course blog on public sector operations research

I am teaching a PhD seminar on public sector operations research this semester [Find it here!]. I am having students blog in lieu of problem sets and exams. You can read my welcome post here and you can read more about the course here. The course is a mix of application and theory, and I expect that the posts will be more about the application than the theory unless the students write about their research. But maybe they will surprise me.

The students submitted their first blog post today. A new post is due every two weeks until the end of the semester. I have to admit that their first blog posts really impressed me. Blog posts were about the students themselves, how they discovered operations research, and what they hope to learn in the class. Students discussed specific issues such as an internship at the State of Wisconsin, how to route a bus around a dangerous mountain path, how to measure performance in a human centered system, ethics, disasters, and sports scheduling.

Please leave comments if you wish. The students are required to read and comment on other blog posts as part of the course. Knowing that the course blog has readers will be a good motivator for the students.

The first two lectures overviewed the history of public sector operations research. Next, we will dive into models (both deterministic and stochastic). I’ll eventually post a list of some of our readings on Punk Rock OR. Stay tuned!

I am looking forward to a good semester with this group of students. On Wisconsin!


operations research is optimistic

I am teaching a course on Public Sector Operations Research this semester. I included this quote from a paper by Rittel and Webber about optimism in my introductory lecture.

“Planning and the emerging policy sciences are among the more optimistic of those professions. Their representatives refuse to believe that planning for betterment is impossible, however grave their misgivings about the appropriateness of past and present modes of planning. They have not abandoned the hope that the instruments of perfectability can be perfected.”

Horst W.J. Rittel and Melvin M. Webber, “Dilemmas in a general theory of planning,” Policy Sciences 4, 1973.

Operations research is one part planning: we build math models to inform decisions. We do this because we believe we can make a difference. And we believe we can make a difference because we are inherently optimistic.

Do you agree that operations research is optimistic?


operations research improves school choice in Boston

Many cities allow families to choose elementary schools to address growing inequities in school instruction and performance. School choice lets families give a rank ordering of their preferred schools, and a lottery ultimately assigns students to schools. The result is that many students have to travel a long way to school, crazy bus schedules, and students on the same block who do not know each other because they go to different schools.

Peng Shi at MIT (with advisor Itai Ashlagi) won the 2013 Doing Good with Good OR Award held by INFORMS with his project entitled “Guiding school choice reform through novel applications of operations research” that addressed and improved Boston’s school choice model.  I am pleased to find that his paper based on this project is in press at Interfaces (see below).

The schools in Boston were divided into three zones, and every family could choose among the schools in their zone. Each zone was huge, so on any given block, students might be attending a dozen different schools. See a graphic in a Boston Globe report to see more about the problem.

Peng balanced equity with social problems introduced with the choice model by proposing a limited choice model. His plan was to let every family to choose among just a few schools: the best and the closest. Families could choose from the 2 closest in the top 25% of schools, the 4 closest in the top 50% of schools, and the 6 closest top 75% schools, the 3 closest “capacity schools,” and any school within a mile. There was generally a lot of overlap between these sets, so families had about 8 choices in total (a lot less than the original school choice model!). This gave all families good choices while managing some of the unintended consequences of a school choice system (busing and transportation, distant schools, neighbors who didn’t know each other).

The model itself was not obvious: there is no “textbook” way to model choice. Peng visited with the school board and iteratively adapted and changed his model to address concerns within the community.  This resulted in the model becoming simpler and more transparent to parents (most parents don’t know about linear programming!). The new model pairs above average schools with below average schools in a capacity-weighted way to make school pairs have comparable average qualities. This lets families choose from school partners, the closest four schools, and schools within a mile.

The school board voted to adopt his plan. Peng worked with the school district to come up with important outcomes to evaluate. The model itself uses linear programming to “ration” school seats probabilistically among students by minimizing the expected distance subject to constraints. To parameterize the model, he used a multinomial logit model to fit the data (with validation). He also ran a simulation with Gale-Shapley’s deferred acceptance algorithm as a proof of concept to ensure that the model would work.

See Peng Shi’s web site for more information. Some of his documentation is here.

I’ve been on the INFORMS Doing Good with Good OR Award committee for the past three years. This award honors and celebrates student research with societal impact. I love this committee – I get to learn about how students are making the world a better place through optimization. And these projects really do make a difference: all applications must submit a letter from the sponsor attesting to improvements. Submissions are due near the end of the semester (hint hint!)

Reference:

Guiding School-Choice Reform through Novel Applications of Operations Research by Peng Shi
Interfaces articles in advance
Permalink: http://dx.doi.org/10.1287/inte.2014.0781


operations research for drug policy and addiction

I enjoyed listening to Jon Caulkins’ Omega Rho lecture at the INFORMS Annual Meeting. The abstract for the talk is:

Operations Research in Service of Drug and Addictions Policy: Lessons from and for the Discipline of Operations Research
Jonathan P.Caulkins
H.Guyford Stever Professorship of Operations Research and Public Policy
Carnegie Mellon University

I am an OR missionary. I have carried our tools and perspectives into the fields of drug policy and addiction. When traveling far afield, one often encounters opportunities to do good by applying what seem to be quite basic precepts back home, and one returns with a deeper understanding of one’s own culture and its strengths and weaknesses. That has certainly been true of my professional tour. I will share success stories – instances in which by virtue of being the only person thinking about an issue from the perspective of a math modeler, I was able to make fundamental contributions by doing analyses that anyone with training in OR would view as quite elementary. I will also try to share some insights into our disciplinary culture. Drug policy, like most policy domains, is inherently interdisciplinary. So I work with scholars from many disciplines. That experience has given me an appreciation of different disciplines’ strengths and limitations when grappling with messy unstructured problems. I firmly believe that diversity is essential to good decision making, including disciplinary diversity. But I am also interested in which disciplines’ graduates are leaders, not just members, of the teams that shape high-level and strategic decision making. I will close with some thoughts about how we might increase our discipline’s “market share” within t! hose leadership roles.

This was an interesting talk about being an OR practitioner and solving real problems. Jon talked about the general principles he uses to influence policies. This involves doing good work, but more importantly, it involves asking good research questions. Jon asks excellent research questions. Jon summarized the impact his answers to these questions have had on policy. Jon’s work modeled drug lifetimes and life cycles using Markov chain models, a feature common to all drug types that could be used to forecast when drugs would go out of favor. He talked about modeling types of users–heavy and light–and the insights one can obtain when considering different classes of users. I enjoyed the discussion on pricing and drug purity, two issues that are often overlooked by decision makers and therefore have impact.

A really great part of the talk was when Jon took on Big Data. He said that in his experience, being the first with any data at all is really important for influencing policy. Many times, public safety leaders make decisions with zero data points or one data point (an anecdote!). Going from 0 to 100 data points can change a policy, going from 100 data points to “Big Data,” not so much.

https://twitter.com/lauramclay/status/531594972118913026

David Hutton blogged about Jon’s talk on the INFORMS2014 blog [Link].

Earlier posts about Jon Caulkins’ talks:


reverse auctions for the television spectrum and graph coloring problems

Karla Hoffman from George Mason gave an nice talk at the 2013 INFORMS Computing Society Conference about reverse auctions to buy back the TV spectrum. It is an issue if you still use an antenna to watch TV (see the bottom of this post if you are shocked that people still use antennas).

Here is the problem. Once upon a time, the FCC gave the networks the bandwidth. Changes in technology — the move to digital and the needs of broadband — have motivated the need to reassign the spectrum to stations. This will happen in 2014.

The reverse auction problem of assigning networks to a piece of the spectrum. A station requires 6MHz of the spectrum plus a buffer. The same piece of the spectrum could be assigned to stations in, say, Denver and Baltimore. The same antenna would not be able to pick up both stations, and therefore, there would be no interference.  But different stations in, say, Washington DC and Baltimore could not share the same piece of the spectrum.

This leads to a graph covering problem:

  • the TV stations are the vertices
  • there is an edge between two TV stations if the TV stations are nearby (i.e., an antenna could pick up both stations if they are close enough)
  • 6MHz chunks of the spectrum are the colors.

If you’re not familiar with the graph (or vertex) coloring problem, here is the general idea. It is an assignment of “colors” to vertices on a graph, where no two adjacent vertices share the same color [Link]. Coloring a map is a type of graph coloring problem on a planar graph, where the states are the vertices and there is an “edge” between two states if they share a border. This leads a map where no two adjacent states have the same color (see below).

Example of a solution to a graph coloring problem

There are some additional side constraints in the TV spectrum coloring problem, such as UHF and VHF designations and public service space reserved in the spectrum. It’s a complex problem.

The graph coloring problem is a feasibility problem (can I color my graph with 4 colors?) There are only so many “colors” available in the TV spectrum. The graph coloring problem described above could thus lead to infeasible solutions, and this may be an issue in the auctions (a bid should not be accepted if that would lead to an infeasible solution). This motivates the need for a feasibility checking routine during the auctions. Later, broadcasters that do not participat or whose bids are not accepted must be reassigned to the remaining TV stations available.

In terms of the auctions, there are plenty of other challenges, such as planning what the auction will look like, how pricing will be handled, and how one will determine a winner.

In the US, about 10% of people use antennas. Two people in the audience (including me) still use bunny ears. This was such  shocking news for one attendee that he posted it to twitter:

Mike Trick

I try to stay too busy blogging to have time for TV (:

I probably got some of the details about the auctions wrong. It’s a complex problem and Karla did a great job of distilling the essence of the problem without overwhelming us with unneccessary details (there were a lot of necessary details). If you know more about these auctions and how OR will be used, please leave a comment.

Related posts:


the exit polling supply chain

A WSJ Washington Wire blog post describes the Presidential election exit polling supply chain in New York in the immediate aftermath of Hurricane Sandy. The Washington Wire blog post highlights the polling firm Edison Research, based in New Jersey. Edison provided the questionnaires used by pollsters who would collect information about the ballots cast. As you might recall, New Jersey and New York were extremely damaged from the hurricane.

Questionnaires

One of the logistical challenges was in printing and delivering the questionnaires used by pollsters around the country. The questionnaires need to be timely, so they are usually shipped one week before the election. Sandy was on track to strike 8 days before the election, so a rush order was placed with the printer. Two thirds of the questionnaires were mailed before Sandy struck and Edison’s election office lost power along with the rest of New Jersey. The rest of the questionnaires were stored for two days until they had to be shipped. Edison printed the mailing labels from their main office, and then UPS shipped the 400 packages to pollsters via Newark Airport. While Edison had redundancy in their system (e.g., the mailing labels could be printed in another facility and a redundant system alerted employees of the change), it only worked because not all of their offices lost power.

Mail Delivery

While Edison relied on UPS to deliver the mail, it is worth noting that USPS mail service continued as normal except for one day during Hurricane Sandy (HT to @EllieAsksWhy).

Gas

Edison relied on having employees implement Plan B. With the gas shortage, it was difficult for employees to get to work when they needed to save gas for other car trips. Organizing car pools was more difficult than normal, since employees could not rely on communicating by email or cell phone.

Hotels

As I mentioned in an earlier post, there were few/no vacancies at hotels that had power, which provided challenges for Edison employees who wanted to work out of a hotel (most offices and homes were without power) or pollsters who needed to travel to different cities to perform exit polling.  I’m not sure how these issues were resolved.

Local transportation to the polls

The NYC public transportation was up and running on election day, so the pollsters could make it there for the big day. The subway reopened with limited runs the Thursday before Election Day and was running as usual on Election Day.

What if Hurricane Sandy came later?

Edison Research managed, but having an 8 day head start was helpful for successfully completing a contingency plan. If the hurricane hit 5 days or closer, the questionnaires would have already been printed and mailed. However, there may have been more challenges with getting pollsters to the polling locations in New York City and other locations (the subway may still have been closed on Election Day).

Related posts: